| Home | Sign up! | Projects | Seminars | Research Notes | Today's Lecture | About |
Edward D'CostaEmail
eddcosta@gmail.com
| Profile:
Post-Graduation:
M. S. - Computer Information Systems--> Tarleton State University, USA + Ansal Institute of Technology, Gurgaon, India (Twinning Program arrangement)
Graduation:
B. A. (Hons.) Economics, Delhi University (India)
Software Projects:
- Developed an L-R parser for ‘Data Definition Language (DDL) change-tracker’ using Visual Basic .Net and its Regular Expression suite of commands;
- Converted a windows-based ‘Work-Order’ Tracking and Reporting tool from VB 6 to Visual Basic .Net (back-end database in SQL Server 2000);
- Developed a Seminar Participant Registration System using VB .Net (back-end database in MS-Access 2003);
- Used VB .Net to build a heuristics-based Connect Four game;
- Developed a DDL (Data Definition Language) translator in Visual Basic .Net;
- Coded a Video Library System using Sybase as the RDBMS back-end and C++ as the front-end; and
- Created a Company Payroll-System using MS-Access as both the back and front-end.
Download
Data Mining
Master’s Thesis
by
Edward D’Costa
Thesis Supervisor
Prof. Ashay Dharwadker
Ansal Institute of Technology
15th April 2004
Abstract
This thesis is a survey of Data Mining techniques with an emphasis on
Time Series analysis. A brief history of the development of the field
and its extreme usefulness in today’s world of large databases is discussed.
The architecture of a typical data mining system is studied with examples
and applications. Time series, Seasonal Variations, Exponentially Smoothed
Weighted Moving Averages (ESWMA), Partial Auto-Correlation Functions (PACF)
and the Box-Jenkins methodology are studied in detail, with examples. We
have implemented the ESWMA/PACF based trend curve fitter application in
C++ and provide the source code of the software under the GNU public license
for noncommercial use on the accompanying CD.
Contents
1. What is Data Mining?
2. History of Data Mining
3. Some other terms for Data Mining
4. Functions of Data Mining
5. From ‘Data’ to ‘Knowledge Discovery’
6. Architecture of a Typical Data Mining System
7. Real-life Applications of Data Mining
7.1 An Example of a Data Mining Business Software at Eddie Bauer
7.2 Other Examples
8. Data Mining – On What Kind of Data?
8.1 Theoretical Concepts Involved
9. Time Series
9.1 What is Trend Measurement?
9.2 Method of Moving Averages (MA) to Determine Trend
9.3 Criteria for the selection of Period for the Moving Average
10. Components of Time Series
11. Seasonal Variations
11.1 Measurement of Seasonal Variations
11.2 Uses of Seasonal Index
11.3 Ratio-to-Moving Average method of measuring Seasonal Variations
12. Exponentially Smoothed Weighted Moving Average (ESWMA)
12.1 Implementation into Software Application
12.2 Proposed Improvements in Current Version of ESWMA–based Trend
Curve fitter Application
13. References
|
Prof. Ashay Dharwadker's Courses (3): | Course | Semester | Grade | | | MS Project | Fall 2003 | View | | | Database Systems | Fall 2003 | View | | | Computer Networks | Spring 2004 | View | |
|
Project ID: 24
Course: MS Project
Topic: Applying data mining on the Airline Industry database
| Description: Data mining refers to extracting or ‘mining’ interesting knowledge from large amounts of data.
Some other terms:
- knowledge mining from databases, or
- knowledge extraction, or
- data/pattern analysis, or
- data archaeology, or
- data dredging, or
- Knowledge Discovery in Databases (KDD).
The Journey from 'Data' to 'Knowledge Discovery':
Architecture of a Typical Data Mining System:
Geting Down to Specifics of my Data Mining Project:
I plan to apply data mining techniques on my airline database that I have already developed for my 'DATABASE SYSTEMS'
class. As of now, I will be using PHP programming techniques, like the 'pattern-matching' commands, to do the
same.
Theoretical Concepts Involved:
When it comes to mining types of data, there are 6 such types/branches of study:
- Multi-dimensional Analysis and Descriptive Mining of Complex Data Objects
- Mining Spatial Databases
- Mining Multimedia Databases
- Mining Time-Series and Sequence Data
- Mining Text Databases
- Mining the World Wide Web
Of the above, my project would focus on the techniques of mining Time-Series and Sequence Data. |
Project ID: 25
Course: Database Systems
Topic: Airline Database
| Description: In my Database Systems project, I propose to develop a relational database for the airline industry. My other team member is Saugato Ray, a sophomore of Tarleton State University, USA and pursuing the Bachelor of Science (Computer Information Systems) course. The open-source MySQL database software is the back-end responsible for maintaining the RDBMS. The front-end web-interface would be developed using PHP and it would allow a user to easily access, insert, update, and delete data into the MySQL database. The PHP front-end would be entirely menu-driven, and would enable any user with minimal computing knowledge to run various types of queries, enter/modify data through forms, generate reports, print tickets/flight schedules, etc.
The MySQL queries that we have used to create our airline database 'airliners_inc' are as follows:
create table airlines (arl_code varchar(5) not null, arl_comp varchar(25), country varchar(30), addr varchar(100), tel_no varchar(25), primary key(arl_code));
create table aircraft_type (arft_code varchar(10) not null, manuf varchar(15), model varchar(10), capacity int(4), primary key(arft_code));
create table airports (arpt_code varchar(6) not null, arpt_name varchar(50), city varchar(50), country varchar(30), addr varchar(100), tel_no varchar(25), terminals int(3), primary key(arpt_code));
create table passenger (p_sno int(9) not null, lname varchar(30), fname varchar(30), sex varchar(2), age int(3), addr varchar(100), email_id varchar(40), pssprt_no varchar(20), class varchar(10), zone varchar(15), meal varchar(10), assistance varchar(3), primary key(p_sno));
create table passenger_contact (passcon_sno varchar(9) not null, lname varchar(30), fname varchar(30), addr varchar(100), tel_no varchar(25), email_id varchar(40), primary key(passcon_sno));
create table flight_timetable (fl_no varchar(8) not null, days varchar(30), dep_arpt_code varchar(6), dep_datetime datetime, trans_arpt_code varchar(6), trans_datetime datetime, trans_fare decimal(6,2), dest_arpt_code varchar(6), dest_datetime datetime, dest_fare decimal(6,2), primary key(fl_no));
create table universal_time_zone_diff (city varchar(50) not null, country varchar(30), gmt_diff dec(3,2), primary key(city));
create table arln_craft (arl_code varchar(5) not null, arft_code varchar(10) not null, primary key(arl_code, arft_code), foreign key(arl_code) references airlines, foreign key(arft_code) references aircraft_type);
create table pass_con (p_sno int(9) not null, c_sno int(9) not null, primary key(p_sno, c_sno), foreign key(p_sno) references passenger, foreign key(c_sno) references passenger_contact);
create table ticket (p_sno int(9) not null, fl_no varchar(8) not null, primary key(p_sno, fl_no), foreign key(p_sno) references passenger, foreign key(fl_no) references flight_timetable); |
Project ID: 46
Course: MS Project
Topic: Data Mining Using ESWMA
| Description: When it comes to mining types of data, there are 6 such types/branches of study:
- Multi-dimensional Analysis and Descriptive Mining of Complex Data Objects
- Mining Spatial Databases
- Mining Multimedia Databases
- Mining Time-Series and Sequence Data
- Mining Text Databases
- Mining the World Wide Web
Of the above, my project focuses on the techniques of mining Time-Series and Sequence Data.
One of the most important tasks before businessmen and economists these days is to make estimates for the future.
Therefore, I have embarked upon the job of developing a software which is able to deduce a trend (and eventually forecast) out of data given in the form of a time series. This field of analysing time series and making forecasts comes under the broad category of DATA MINING.
Time Series defined
“A time series is a set of statistical observations arranged in chronological order.”
- Morris Hamburg
What is Trend measurement?
Given any time series, the first step towards forecasting is to determine and present the direction which it takes - i.e. is it growing or declining? This is TREND measurement.
Method of Moving Averages to Determine Trend
Is the most widely used method of measuring seasonal variations. In determining trend by the by the method of moving averages, the averages for a pre-determined set of periods (years/months/weeks) is secured, and this value now represents the normal/trend value for the unit of time lying in the middle of the period covered in the in the calculation of the average.
The effect of averaging is to give a smoother curve (when drawing the trend line), and lessening the influence of the fluctuations that pull the time-series’ figures away from the general trend.
When applying the Moving Average method, it is necessary to select a period for the moving average, such as a 200-day moving average, 3-monthly moving average, 4-quarterly moving average, 5-yearly moving average, etc.
Criteria for the Selection of Period for the Moving Average
The period of the moving average is to be decided in the light of the length of the cycle between any 2 consecutive peaks on the ACTUAL TREND LINE (i.e. the trend line formed by plotting the actual data values of the time series). Once the cycle length is known, the ‘ideal’ period for the Moving Average is given by:
Ideal Period OR Length of Moving Average = (Cycle Length)/2 + 1
Exponentially Smoothed Weighted Moving Average
The simple moving averages method, we have discussed so far, gives equal significance to all the days in the average. However, this need not be so. If one thinks about it, it actually does not make much sense, especially if one is interested in using a longer-term MA to smoothen-out random bumps in the trend. Assuming one to be using a 20-day moving average, why should the data almost 3 weeks ago be considered equally relevant to the data recorded today morning?
Various forms of ‘weighted’ moving averages have been developed to address this objection. One such technique is the ‘Exponentially Smoothed Weighted Moving Average’ (or ESWMA, for short).
Exponential Smoothing gives maximum significance to the most recent data and decreasing significance to data which pertains to older instances of time. The weight factors in an exponentially smoothed MA are successive powers of a number called the ‘smoothing constant’. A smoothing constant less than 1 weighs recent data more heavily, with the bias towards the most recent measurements increasing as the smoothing constant decreases towards 0. If the smoothing constant exceeds 1, older data are weighed more heavily that recent measurements.
The formula for ESWMA is given by:
E = (c1. t1 + c2.t2 + ……………… + cn.tn)/n
where,
c: Smoothing Constant (and, for all practical purposes, 0
t1, t2, ……., tn : Time Series data – with t1 being the most recent data
n: period of the MA, and
E: ESWMA
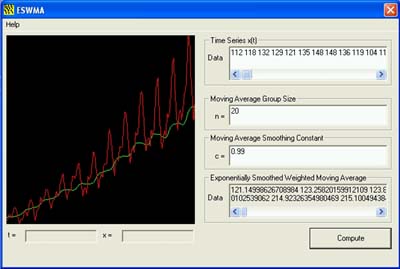
Implementation into Software Application:
Using C++ and Windows MFC Programming, a software application has been developed to deduce the trend values using the ESWMA technique, and further plotting these values on a 2-dimensional plane (using OpenGL) to obtain the ‘Exponentially Smoothed Trend Curve’.
|
Seminar ID: 15
Course: Database Systems
Topic: MS Project - Progress Report I
| Description:
Data mining refers to extracting or ‘mining’ interesting knowledge from large amounts of data.
Some other terms:
- knowledge mining from databases, or
- knowledge extraction, or
- data/pattern analysis, or
- data archaeology, or
- data dredging, or
- Knowledge Discovery in Databases (KDD).
The Journey from 'Data' to 'Knowledge Discovery':
Architecture of a Typical Data Mining System:
Geting Down to Specifics of my Data Mining Project:
I plan to apply data mining techniques on my airline database that I have already developed for my 'DATABASE SYSTEMS'
class. As of now, I will be using PHP programming techniques, like the 'pattern-matching' commands, to do the
same.
Theoretical Concepts Involved:
When it comes to mining types of data, there are 6 such types/branches of study:
- Multi-dimensional Analysis and Descriptive Mining of Complex Data Objects
- Mining Spatial Databases
- Mining Multimedia Databases
- Mining Time-Series and Sequence Data
- Mining Text Databases
- Mining the World Wide Web
Of the above, my project would focus on the techniques of mining Time-Series and Sequence Data.
|
Seminar ID: 49
Course: MS Project
Topic: MS Project - Progress Report II
| Description: I presented a seminar on Jan. 15, '04 to apprise the faculty supervisor and classmates of the progress made on my MS Project pertaining to Data Mining. The following is a brief description of the things discussed in the seminar:
When it comes to mining types of data, there are 6 such types/branches of study:
- Multi-dimensional Analysis and Descriptive Mining of Complex Data Objects
- Mining Spatial Databases
- Mining Multimedia Databases
- Mining Time-Series and Sequence Data
- Mining Text Databases
- Mining the World Wide Web
Of the above, my project focuses on the techniques of mining Time-Series and Sequence Data.
One of the most important tasks before businessmen and economists these days is to make estimates for the future.
Therefore, I have embarked upon the job of developing a software which is able to deduce a trend (and eventually forecast) out of data given in the form of a time series. This field of analysing time series and making forecasts comes under the broad category of DATA MINING.
Time Series defined
“A time series is a set of statistical observations arranged in chronological order.”
- Morris Hamburg
What is Trend measurement?
Given any time series, the first step towards forecasting is to determine and present the direction which it takes - i.e. is it growing or declining? This is TREND measurement.
Method of Moving Averages to Determine Trend
Is the most widely used method of measuring seasonal variations. In determining trend by the by the method of moving averages, the averages for a pre-determined set of periods (years/months/weeks) is secured, and this value now represents the normal/trend value for the unit of time lying in the middle of the period covered in the in the calculation of the average.
The effect of averaging is to give a smoother curve (when drawing the trend line), and lessening the influence of the fluctuations that pull the time-series’ figures away from the general trend.
When applying the Moving Average method, it is necessary to select a period for the moving average, such as a 200-day moving average, 3-monthly moving average, 4-quarterly moving average, 5-yearly moving average, etc.
Criteria for the Selection of Period for the Moving Average
The period of the moving average is to be decided in the light of the length of the cycle between any 2 consecutive peaks on the ACTUAL TREND LINE (i.e. the trend line formed by plotting the actual data values of the time series). Once the cycle length is known, the ‘ideal’ period for the Moving Average is given by:
Ideal Period OR Length of Moving Average = (Cycle Length)/2 + 1
Exponentially Smoothed Weighted Moving Average
The simple moving averages method, we have discussed so far, gives equal significance to all the days in the average. However, this need not be so. If one thinks about it, it actually does not make much sense, especially if one is interested in using a longer-term MA to smoothen-out random bumps in the trend. Assuming one to be using a 20-day moving average, why should the data almost 3 weeks ago be considered equally relevant to the data recorded today morning?
Various forms of ‘weighted’ moving averages have been developed to address this objection. One such technique is the ‘Exponentially Smoothed Weighted Moving Average’ (or ESWMA, for short).
Exponential Smoothing gives maximum significance to the most recent data and decreasing significance to data which pertains to older instances of time. The weight factors in an exponentially smoothed MA are successive powers of a number called the ‘smoothing constant’. A smoothing constant less than 1 weighs recent data more heavily, with the bias towards the most recent measurements increasing as the smoothing constant decreases towards 0. If the smoothing constant exceeds 1, older data are weighed more heavily that recent measurements.
The formula for ESWMA is given by:
E = (c1. t1 + c2.t2 + ……………… + cn.tn)/n
where,
c: Smoothing Constant (and, for all practical purposes, 0
t1, t2, ……., tn : Time Series data – with t1 being the most recent data
n: period of the MA, and
E: ESWMA
Implementation into Software Application:
Using C++ and Windows MFC Programming, a software application has been developed to deduce the trend values using the ESWMA technique, and further plotting these values on a 2-dimensional plane (using OpenGL) to obtain the ‘Exponentially Smoothed Trend Curve’.
|
Research Note ID: 5
Course: Database Systems
Topic: Data Mining
| Description: Generally, data mining (sometimes called data or knowledge discovery) is the process of analyzing data from different perspectives and summarizing it into useful information - information that can be used to increase revenue, cut costs, or both. Data mining software is one of a number of analytical tools for analyzing data. It allows users to analyze data from many different dimensions or angles, categorize it, and summarize the relationships identified. Technically, data mining is the process of finding correlations or patterns among dozens of fields in large relational databases.
Data Mining - its Applications:
- In business:
Data mining is being primarily used these days by companies with a strong customer focus - like retail, financial, commercial, and marketing organisations. It enables these companies to determine relationships among "internal" factors such as price, product-positioning, or staff skills, and "external" factors such as economic indicators, competition, and customer demographics. And, it enables them to determine the impact on sales, customer satisfaction, and corporate profits. Finally, it enables them to "drill down" into summary information to view detail transactional data.
- Finding terrorists!:
A more out-of-the-ordinary and recent use has been the use of data analysis and data mining technologies as effective tools by FBI investigators for observing certain distinct behaviour/spending patterns of US civilians to ferret out the possible future-terrorists among them.
For further details kindly refer to the following article:
http://www.dmreview.com.
How does Data Mining Work?:
For a comprehensive explanation of how data mining works and the various technologies used, kindly refer to the following links:
|
Research Note ID: 40
Course: Database Systems
Topic: Normalization Process of Databases, & its Forms
| Description: The 'normalization' process of databases refers to the step-by-step decomposition of complex records into simple records. Normalization reduces redundancy using the principle of non-loss decomposition. Non-loss decomposition is the reduction of a table to smaller tables without the loss of information.
Very often the process of normalization follows the process of drawing E/R diagrams. However, depending on how detailed and precise the E/R diagram is, the process of normalization may not at all be necessary. The tables derived from the E/R diagram may already be normalized. Infact, they will be, atleast in the first normal form, as we will soon see.
Why Normalize?
Normalization reduces redundancy. Redundancy is the unnecessary repetition of data. It causes problems with storage and retrieval of data.
Types of Normal Forms
Normalization results in the formation of tables that satisfy certain specified constraints, and represent certain normal forms. Normal forms are table structures with minimum redundancy.
Several normal forms have been identified. The most important and widely used of these are the:
- First Normal Form (1 NF),
- Second Normal Form (2 NF),
- Third Normal Form (3 NF), and
- Boyce-Codd Normal Form (BCNF)
The first, second, and third normal forms were originally defined by Dr. E. F. Codd. Later, Boyce and Codd introduced normal form called the Boyce-Codd Normal Form (BCNF).
First Normal Form (1 NF): Here, one needs to set the very basic rules for an organized database by:
- eliminating duplicative columns from the same table; and
- creating separate tables for each group of related data, and identifying each row with a unique column or set of columns (the primary key).
Second Normal Form (2 NF): Data in the table's rows in 1 NF may be redundant. The table should, therefore, be further decomposed without any loss of information.
A table is in 2 NF when it is in 1NF, and further addresses the concept of removing duplicative data by:
- removing subsets of data that apply to multiple rows of a table, and place them in separate tables; and
- creating relationships between these new tables and their predecessors through the use of foreign keys.
Third Normal Form (3 NF): A table is said to be in 3 NF when it is in 2 NF,and another major step is performed by:
- removing columns that are not dependent upon the primary key.
Boyce-Codd Normal Form (BCNF): A table in Boyce-Codd Normal Form is almost the same as 3 NF, except that now we need to introduce new tables (all in 3 NF) for the removed columns so that there is no information-loss. |
Research Note ID: 63
Course: Computer Networks
Topic: Wireless Networking
| Description: Wireless networking is one of several ways to connect computers. It creates a network by sending radio-frequency signals
between computers, thereby, enabling them to share information. Since such networks are generally of the size of a LAN, they
are also called Wireless LANs (WLANs).
WLANs enable users to establish and maintain a wireless network connection throughout or between buildings, without the
limitations of wires or cables. Using radio frequency technology, WLANs increase productivity among mobile employees though
network access to e-mail, the Internet, or corporate networks. In-the-office productivity is available anywhere the worker
has WLAN access such as a corporate building or campus, in airports, hotels, or other public wireless hotspots.
Wireless networking technologies take the concept of "no new wires" one step further. In a wireless network, all of the
computers in an organisation's working area broadcast their information to one another using radio signals. This can make
networking extremely easy, especially if one has computers all over one's working area. It also makes it a whole lot simpler
to move computers around. For example, a laptop with a wireless network card is completely portable throughout the working
area of the organisation!
In wireless networking, a peer-to-peer (or point-to-point) wireless network means that each computer can communicate directly
with every other computer on the network. But some wireless networks are client/server. They have an access point, which is a
wired controller that receives and transmits data to the wireless adapters installed in each computer.
There are four types of wireless networks, ranging from slow and inexpensive to fast and expensive:
- Bluetooth
- IrDA
- HomeRF (SWAP)
- WECA (Wi-Fi)
Bluetooth: is a standard developed by a group of electronics
manufacturers that allows any sort of electronic equipment -- from computers and cell phones to keyboards and headphones --
to make its own connections, without wires, cables or any direct action from a user. Bluetooth is intended to be a standard
that works at two levels:
- it provides agreement at the physical level -- Bluetooth is a radio-frequency standard; and
- it also provides agreement at the next level up, where products have to agree on when bits are sent, how many will be
sent at a time and how the parties in a conversation can be sure that the message received is the same as the message sent.
Bluetooth is not widely available yet and is not expected to replace the need for high-speed data networks between computers
.
The companies belonging to the Bluetooth Special Interest Group, and there are more than 1,000 of them, want to let
Bluetooth's radio communications take the place of wires for connecting peripherals, telephones and computers.
IrDA (Infrared Data Association): is a standard for devices to
communicate using infrared light pulses. This is how remote controls operate, and the fact that all remotes use this standard
allows a remote from one manufacturer to control a device from another manufacturer. Since IrDA devices use infrared light,
they depend on being in direct line of sight with each other. Although one can purchase and install an IrDA-based network
capable of transmitting data at speeds of upto 4 megabits per second (Mbps), the requirement for line of sight means that one
would need an access point in each room, limiting the usefulness of an IrDA network in a typical workplace layout.
[Before we talk about HomeRF (SWAP) and WECA (Wi-Fi), we need to understand the original standard that both
of these new specifications are based on. The original Institute of Electrical
and Electronics Engineers wireless-Ethernet specification, known as IEEE 802.11, designated two ways of
communicating between devices and allowed for speeds of upto 2 Mbps. Both communication methods, Direct-Sequence Spread
Spectrum (DSSS) and Frequency-Hopping Spread Spectrum (FHSS), use the frequency-shift keying (FSK)
technology. FSK is the technology that was originally used to connect computers through power/electricity-lines (commonly
referred to as Power-Line Networking). In
frequency-shift keying (FSK) data is sent back and forth over the electrical wires connecting the various computer terminals in one's network.
FSK uses two frequencies, one for '1s' and the other for '0s', to send digital information between the
computers on the network. The frequencies used are in a narrow band just above the level where most line noise occurs.Also,
both DSSS and FHSS are based on spread-spectrum radio waves in the 2.4-gigahertz (GHz) range.
Spread spectrum simply means that data is
sent in small pieces over a number of the discrete frequencies available for use at any time in the specified range. Devices
using direct-sequence spread spectrum (DSSS) communicate by splitting each byte of data into several parts and sending them
concurrently on different frequencies. DSSS uses a lot of the available bandwidth, about 22 megahertz (MHz). Devices using
frequency-hopping spread spectrum (FHSS) send a short burst of data, shift frequencies (hop) and then send another short
burst. Since the FHSS devices that are communicating agree on which frequencies to hop to, and use each frequency for a brief
period of time (less than 400 milliseconds) before moving on, several independent FHSS networks can exist in the same
physical area without interfering with each other. Also, due to FCC (Federal
Communications Commission) restrictions, as well as the fact that FHSS devices generally send data on just two to four
frequencies simultaneously, they only use 1 MHz or less of the available bandwidth. Because they use any given frequency for
such a short time, FHSS devices are less prone to interference than DSSS devices. But DSSS is capable of much greater speed
than FHSS since these devices can send a lot more data at the same time. Currently, FHSS-based devices are easier and cheaper
to produce, which has led the HomeRF group to adopt FHSS as the method of communication for their products.] |
Research Note ID: 74
Course: MS Project
Topic: Data Mining Using Data Cubes on OLAP Systems
| | Description: In contrast to OLAP, which organizes data into predefined multidimensional structures to facilitate exploration, data mining performs the explorative analysis and identifies interesting nuggets of information such as groupings of data for the analyst or manager to examine. Data mining can also create decision trees that can be used to predict future data based on attributes of existing data elements.
Analysis Services incorporates sophisticated data mining algorithms that can be used to analyze data in the relational database or in OLAP cubes. The results of the data mining analysis can also be used with OLAP cubes to enhance explorative analysis. For example, you can let data mining find groupings of customers according to their attributes and then use these groupings to create an additional dimensional view of OLAP data cubes and explore the data from the perspective of these groupings. For more information, see this note in the Microsoft Library.
|
|
Last updated on Sunday, 10th December 2006, 11:21:50 PM.
Prof. Ashay Dharwadker
|
|